Linkerd service mesh CPU footprint on Kubernetes
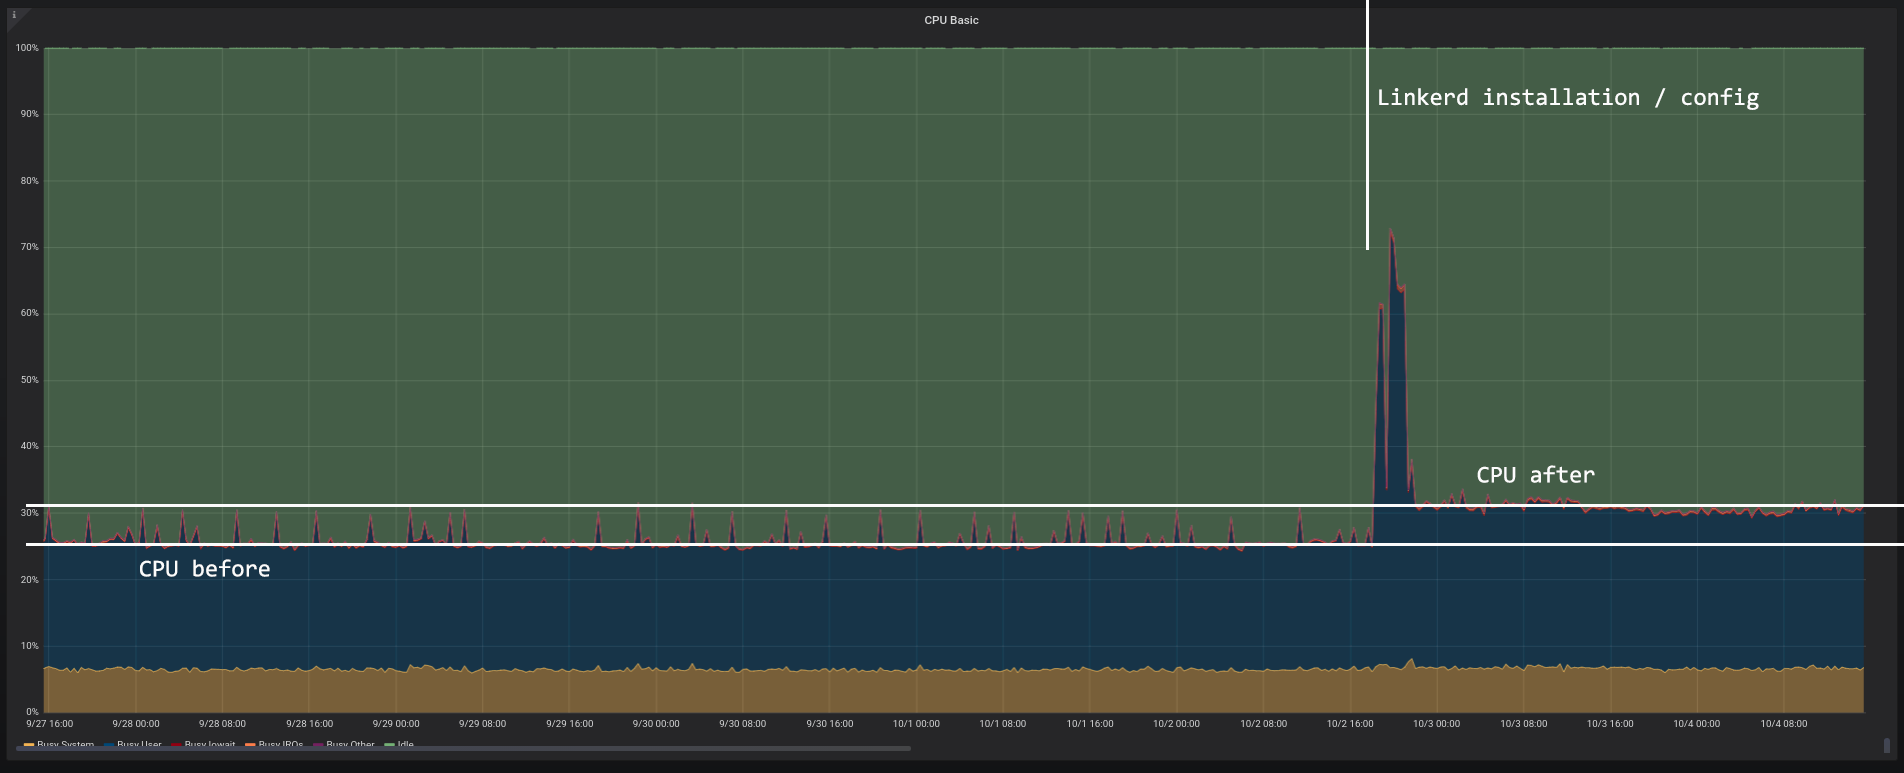
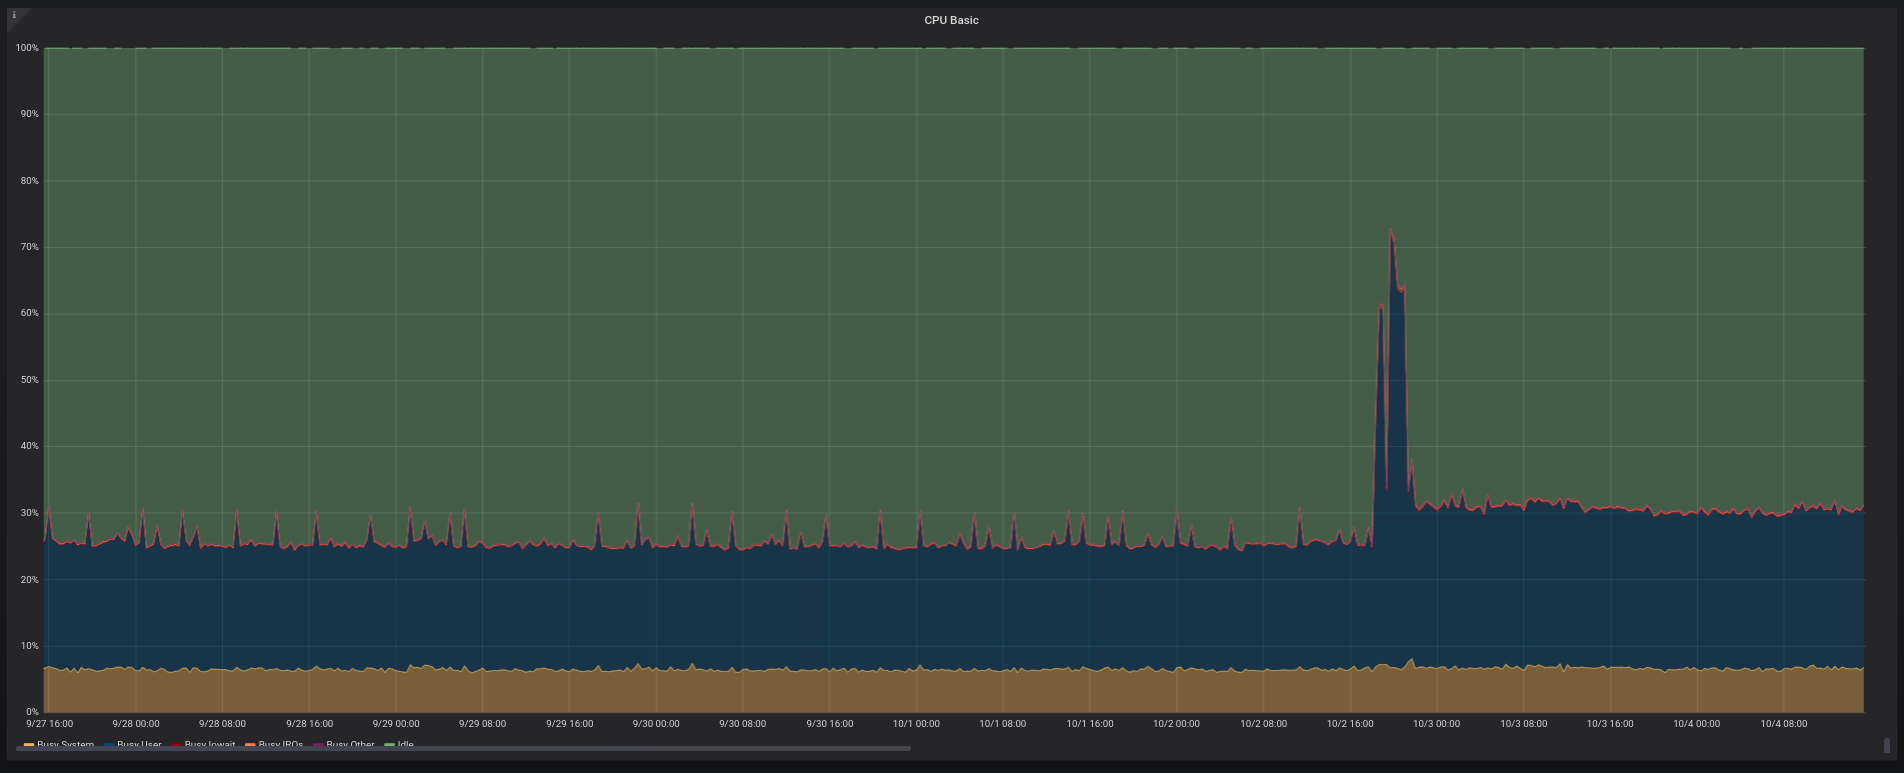
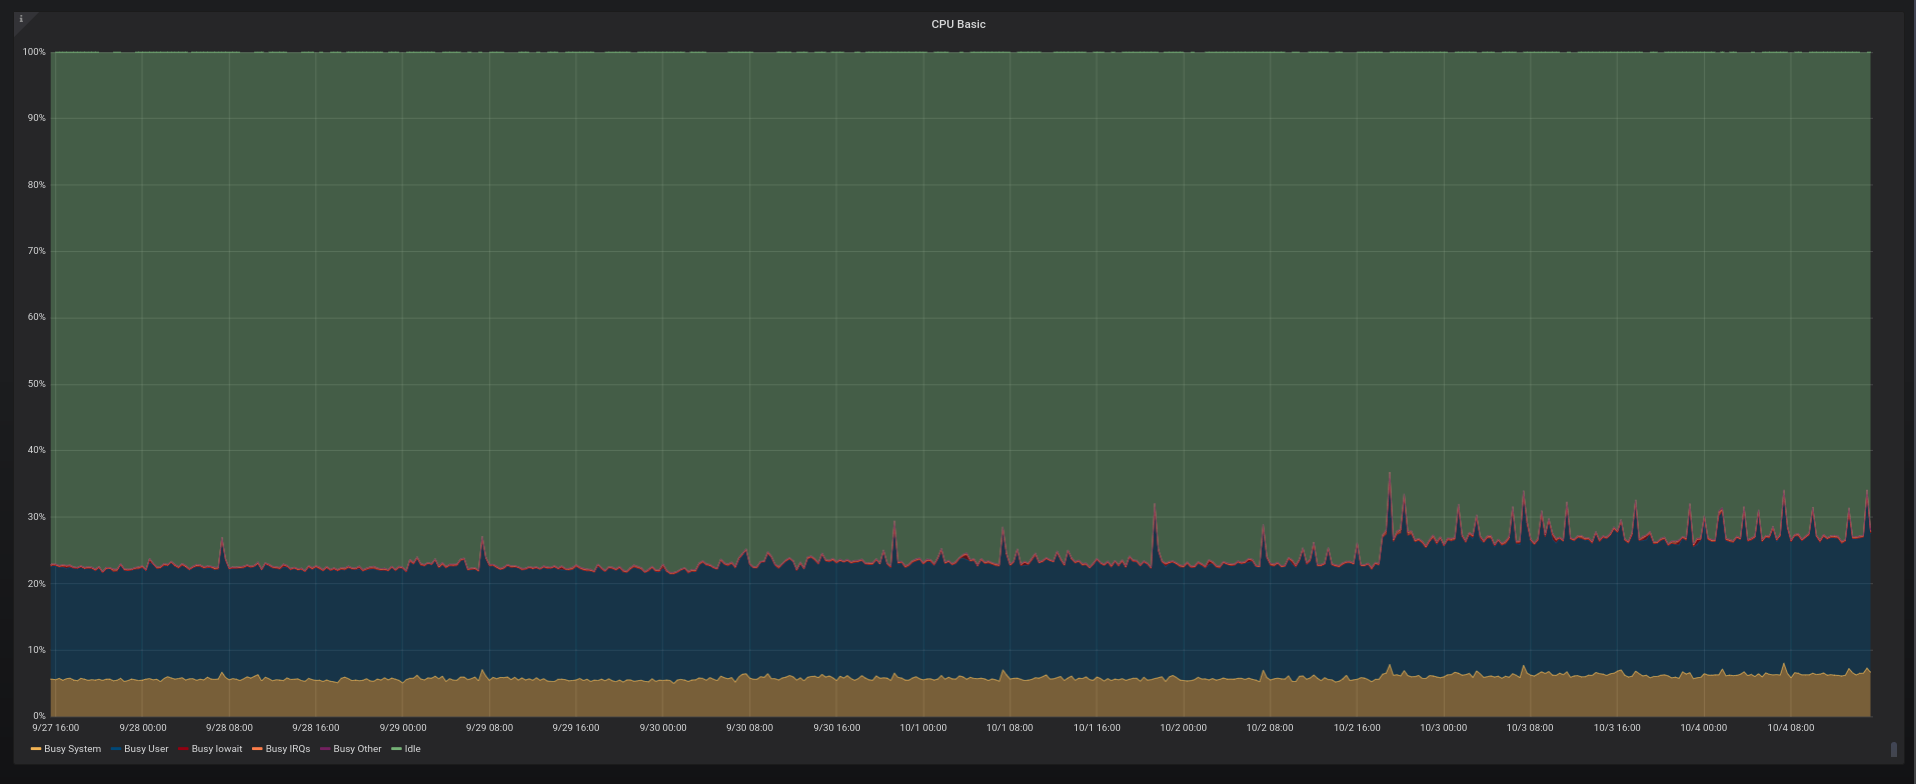
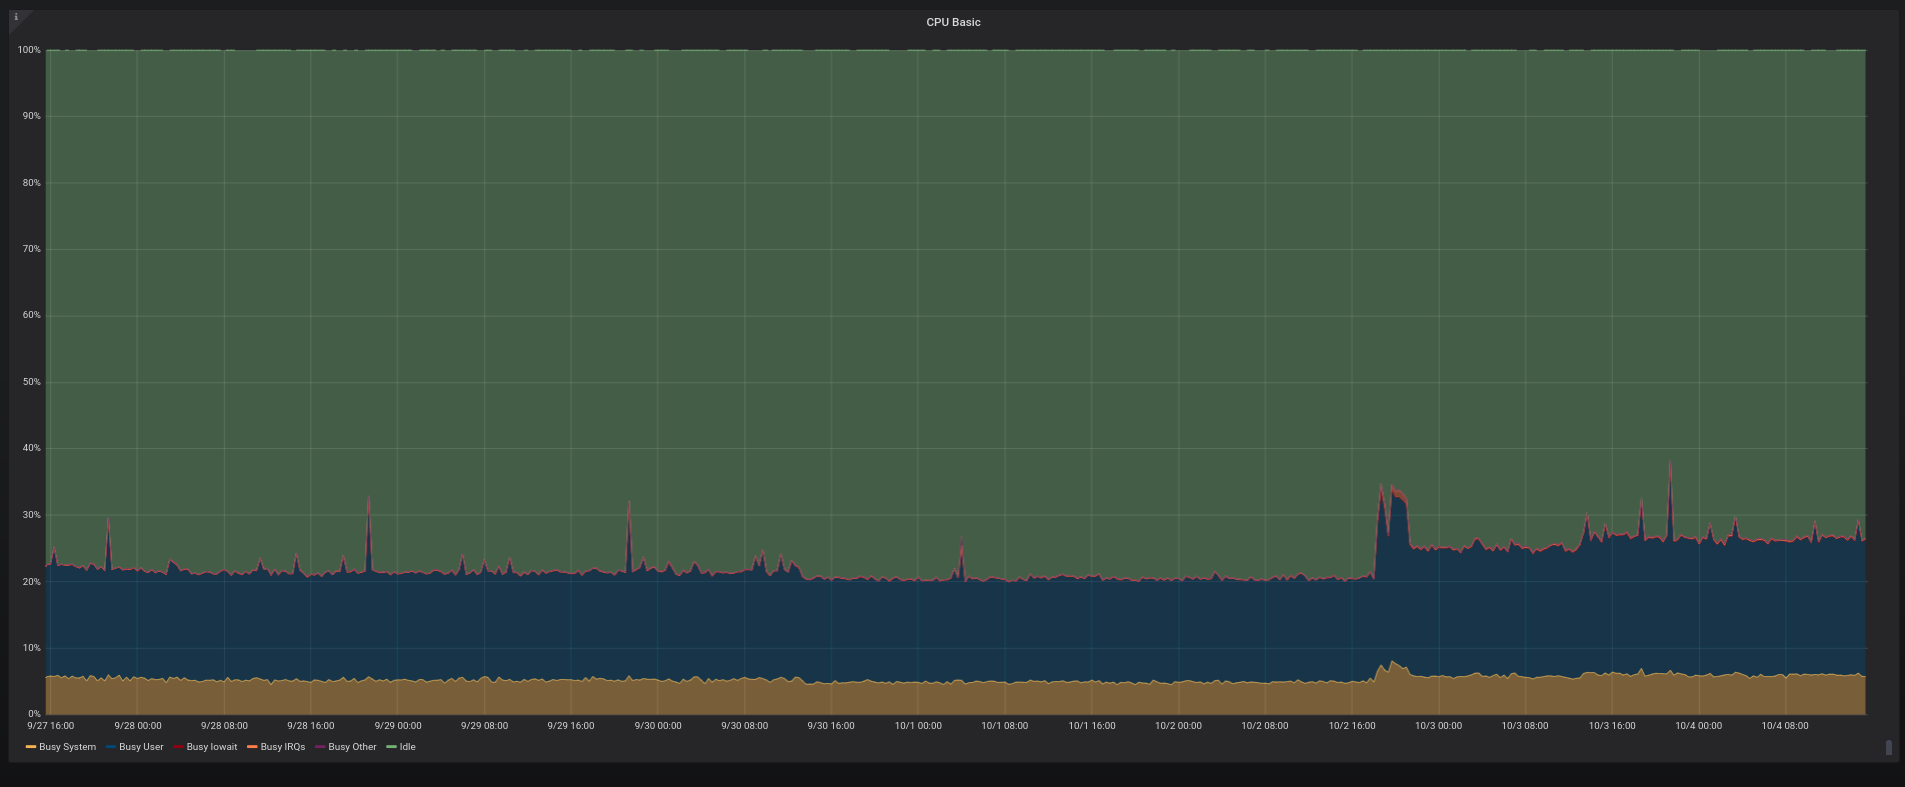
I’ve been using Linkerd for a while on staging environments, but now I finally deployed it to production. And I went to inspect its CPU/memory footprint on my older Prometheus/Grafana setup. The Kubernetes cluster for production is 3-node-sized with 2GB RAM each and it’s running at DigitalOcean. After a whole day since the initial setup (which is really simple) the result is what follows.
CPU at node 1/3 (with annotations)

CPU at node 1/3

CPU at node 2/3

CPU at node 3/3

My reports on memory usage
This Kubernetes cluster is basically running a dozen BEAM instances in production (we’re running a few Elixir APIs). That makes my reports on memory kinda useless due to the way that the BEAM manages its memory. At the end of the day, the memory usage of my containers is tightly related with how long they’re running.
But if you want to see them anyway, here they are: